the 6th wave
visualizing data in three dimensional space
Bauhaus-Bibliotek Weimar
March 2020 Carlos Garcia Fernandez, Christopher Heiden, Dang Thi Hoang Yen, Thi Yen Nguyen, Luis Alberto Alvarez Zendejas
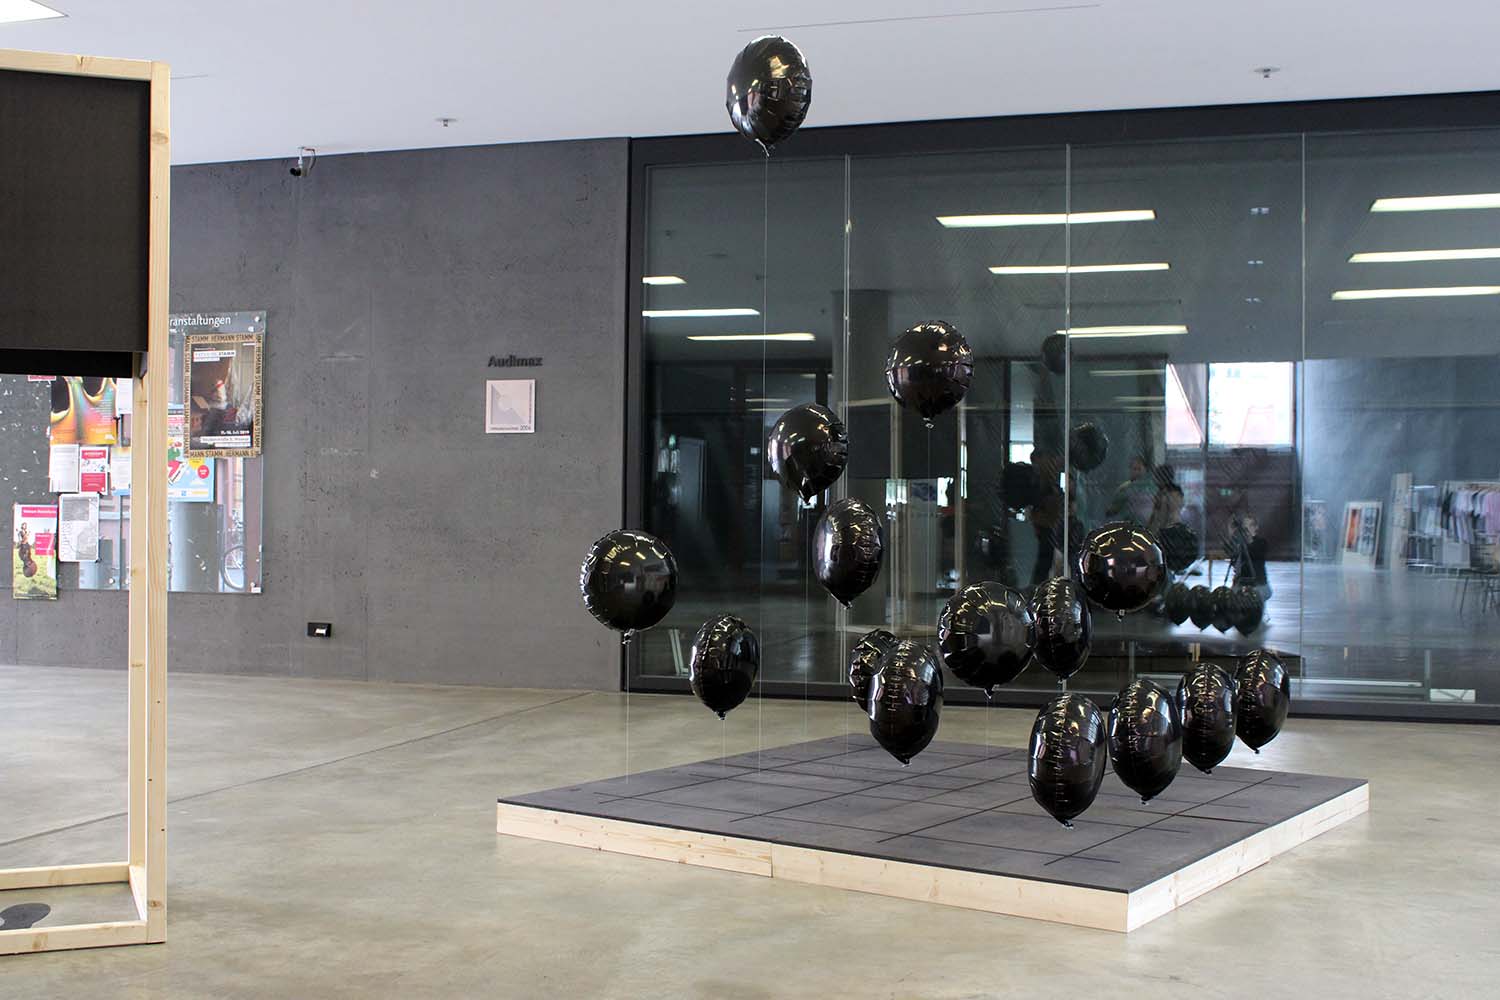
Black balloons are floating weightlessly in the room. Their movements resemble a dance, a choreography: lightweight, yet threatening. What influences their movements? What does control them?
The balloons are controlled by data and the visitor is right in the middle of a sea of data. Data governs our everyday life. And data also unveils the condition of this world. Be it climate data, location data, or – like in this case – data about animal extinction.
The report of the United Nations︎, published in July 2019, which adresses the topic of animal extinction and the accompanying decline in biodiversity paints a severe picture of the destruction of species diversity. More than 1 million out of the 8 million animal and plant species living on earth will be threatened by extinction withing the next years. This is more than ever before in the history of mankind. It's the 6th mass extinction.

As ungraspable as the numbers are the global relations which lead to such a development. This installation aims at making visible abstract data and its interconnections with the help of data physicalization. Compared to data visualization, data physicalization overcomes the limitations of two-dimensionality on paper or the screen by shifting the focus to the physical three-dimensional space. The installation invites its visitors to interact with it, to experience and to explore it.

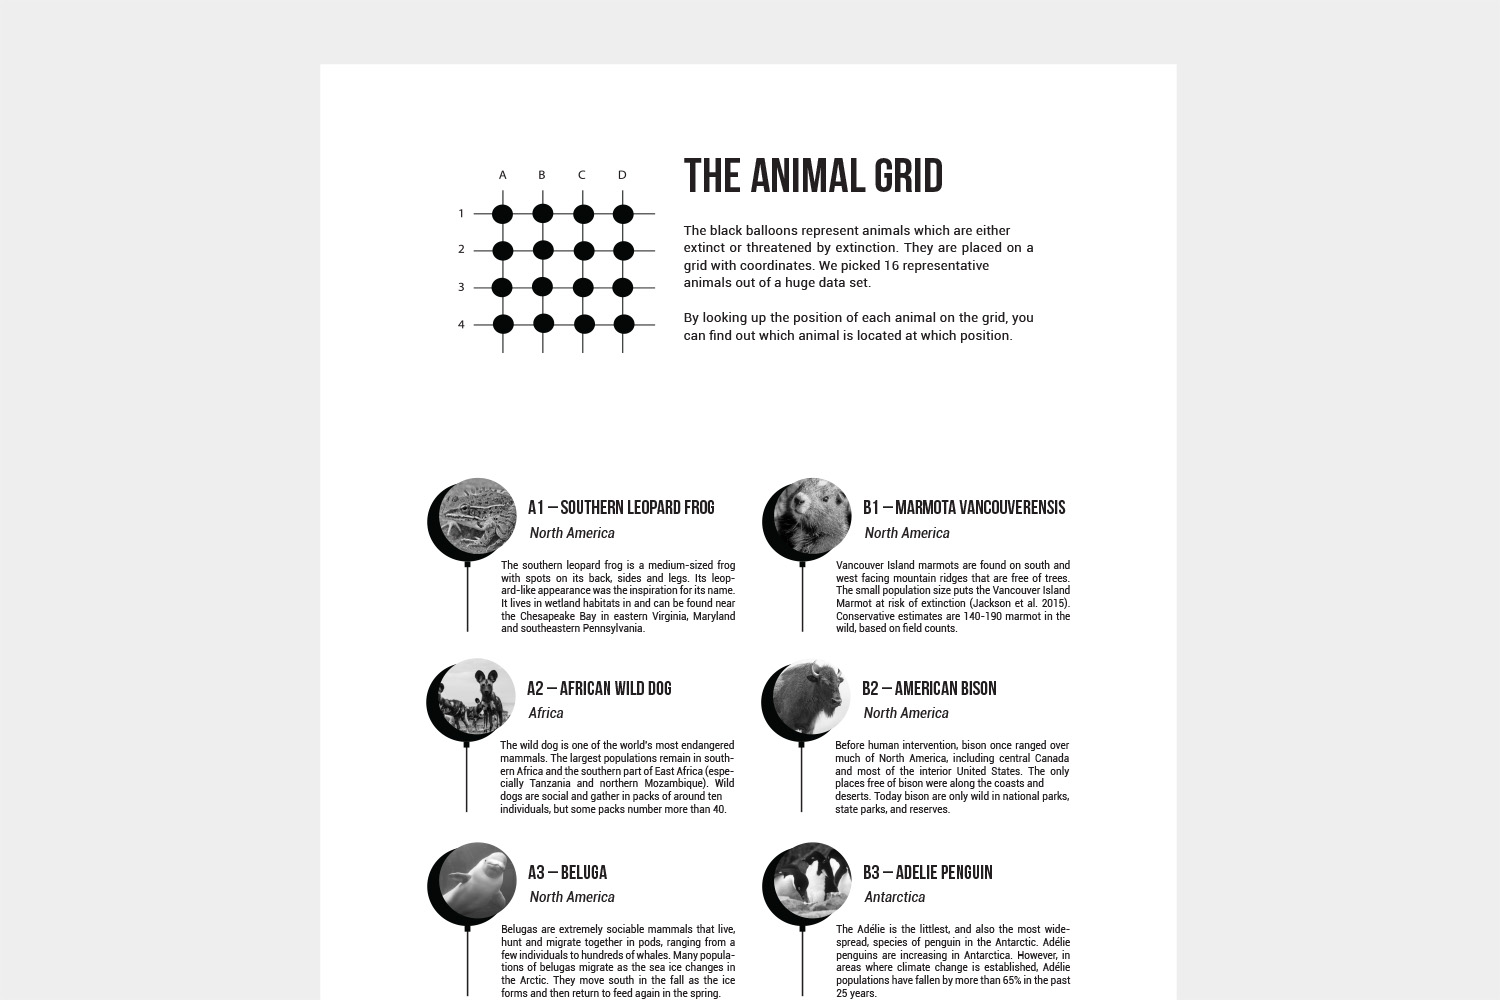
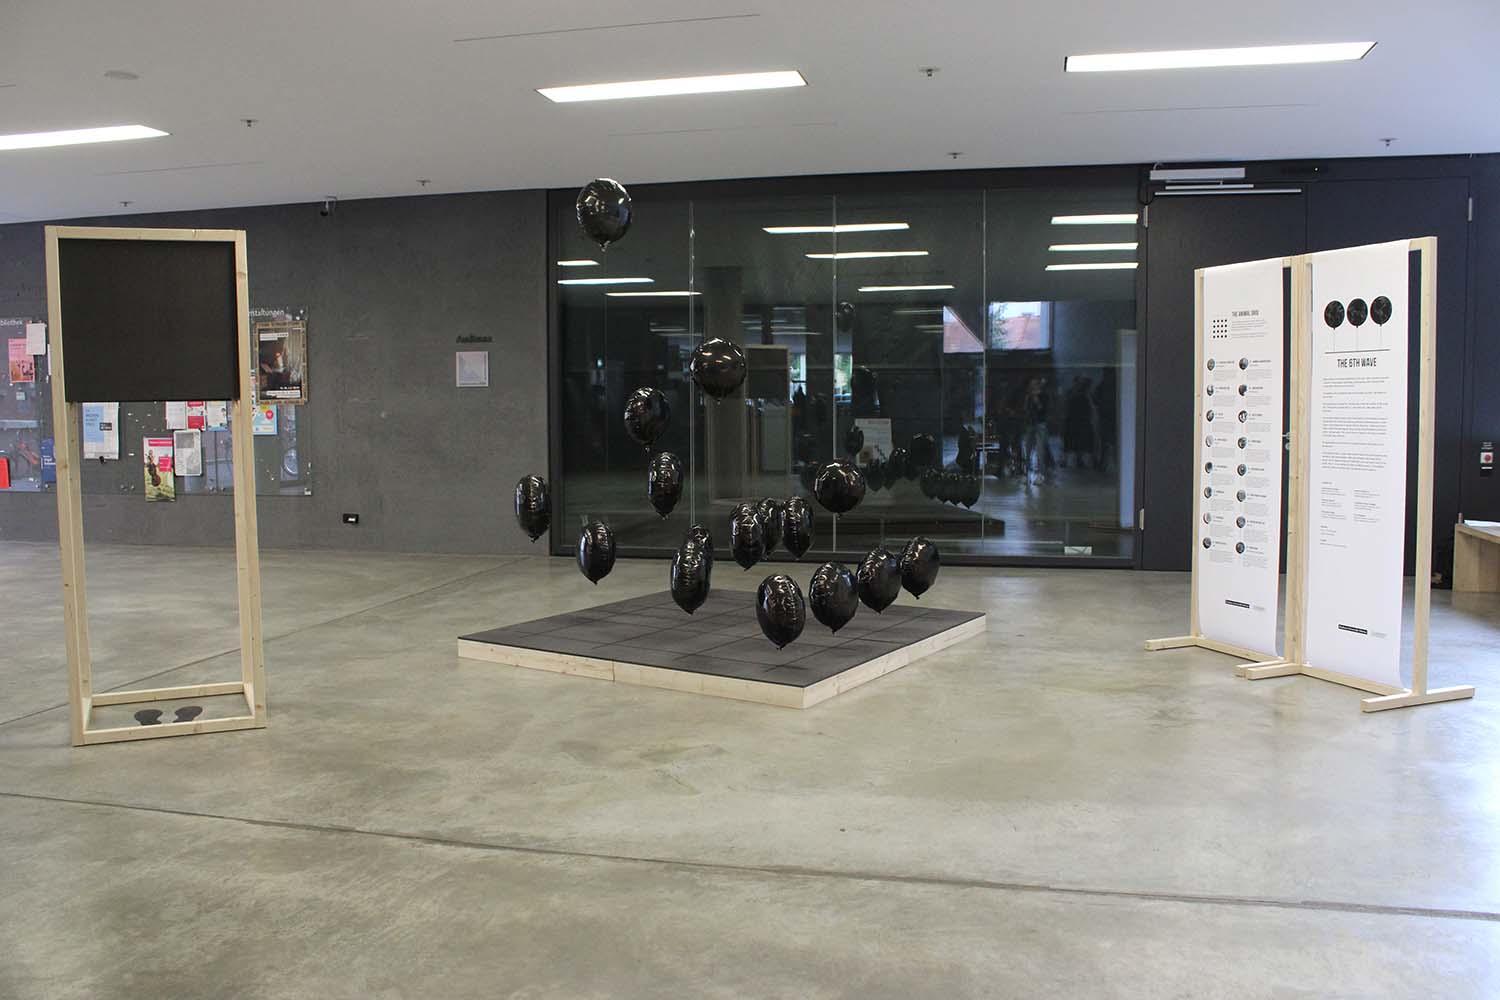
The installation consists of different parts, which are interdependent of each other and work together to form a whole. The main element of the installation is a platform, on which black balloons are mounted. The platform symbolizes the total of the animal world with all of its species. We have chosen animal data from the Living Planet Index︎, then selected certain animals and normalized the data set. In the end, the selected animals depict a curated representation of 16 animals which are mapped to the 16 balloons.
The platform features an engraved grid of x- and y-coordinates with numbers and letters. The grid matches one balloon to one animal. You can check the grid position of the balloon and read about the animal on the poster next to he platform.The platform features an engraved grid of x- and y-coordinates with numbers and letters. The grid matches one balloon to one animal. You can check the grid position of the balloon and read about the animal on the poster next to he platform.
The installation is not just a static work to look at, but you can interact with it. Next to the platform stands a black box which you can enter. Once inside the box, you hear audio files from newscasts from the 1970s to the 2010s featuring important events about the environment, the economy, science or progress in general. By entering the black box, the visitor becomes the switch for the installation and starts it with his or her presence inside the box: the balloons start moving and change their position according to data of animal decline throughout the years.

The whole construction consists of several sensors, modules, microcontrollers and a single-board computer that communicate with each other. The heart of the construction are Arduino Nanos, a Raspberry Pi and a wifi-module (ESP8266). These microcontrollers communicate over a wireless LAN and a bus topology.
The Raspberry Pi sends the animal extinction data to the ESP8266, in the first place. The ESP8266 sends the data to specific Arduino Nanos. Two animal extinction data lists are stored in one Arduino. One data list is represented by one balloon. The Raspberry Pi has the task to sense the presence of a person who enters the black box, plays music and sends information to the ESP8266. The Raspberry creates a webpage and changes data if a person enters the black box. The webpage shows the index of the animal extinction data list that has to be presented by the balloons.
The ESP8266 fetches the index from the webpage and sends it to every Arduino, so they can activate the motors and change the level of the balloons according to the value they have stored in the lists. The values are the amount of how many of this specific animal still lived in a specific year.

